How correlated is the USD:CAD exchange rate to the price of oil?
Within the course of my PhD I have seen the dollar go from just above parity at 1.0297 on September 14, 2012 to a low of 0.6865 USD per CAD on January 19th, 2016 – a 33% decline in value. I’m not sure if it says more about the state of the Canadian economy or just how long I’ve been doing this PhD gig.
The faltering loonie rate has a lot of implications for different Canadians:
- The grocery shopper sees higher prices for imported fruits and vegetables – most notably expensive cauliflower.

Source: Globe and Mail Editorial cartoon
- Central bankers see it as helping re-balance Canada’s economy from the commodity supercycle (which may or may not be over?) to non-energy exports, while softening the blow the resource cycle.

Source: Bank of Canada. An Update – Canadian Non-Energy Exports: Past Performance and Future Prospects - Tourism sees Canadians taking less trips to the US, while Americans spend more time and money in Canada.

Source: Bank of Canada January MPR - Canadian investors see an easy gain on their American investments. In some cases losses on American assets can become gains in Canadian terms, and gains become supergains.
- American companies see bargains for mergers and acquisitions
In the Canadian scientific community we have nothing but bad prospects if the loonie stays persistently low. A lot of consumables our lab uses are priced in USD – the result is we can do less experiments with our already limited budget. Equipment is priced in USD – making new equipment and maintenance more out of reach. The elite conferences are held abroad – including an upcoming Metabolic Engineering conference in Japan (which is priced in USD). And higher salaries in the US can even re-ignite the brain drain of the 1990’s.
Listening to the pundits speak about the price of oil you can’t help but feel like the party is over for those who prefer a higher Canadian dollar. OPEC is saying we won’t have $70 oil until 2020 and $95 oil until 2040. Bank of Canada Stephen Poloz speaks about a permeant loss in national income.
This got me thinking about the future prospects of the loonie.
- How correlated has the loonie been with the price of oil?
- Has this relationship changed since the commodity supercycle began?
I recently learnt Python during my PhD which means answering these questions has become a lot easier compared the the early days of this blog when I was limited by all the clicks required for Excel-based analysis.
I used the noon FX rate from the Bank of Canada and WTI price from Quandl
The first graphs we should look at are the historical exchange rate and WTI price.

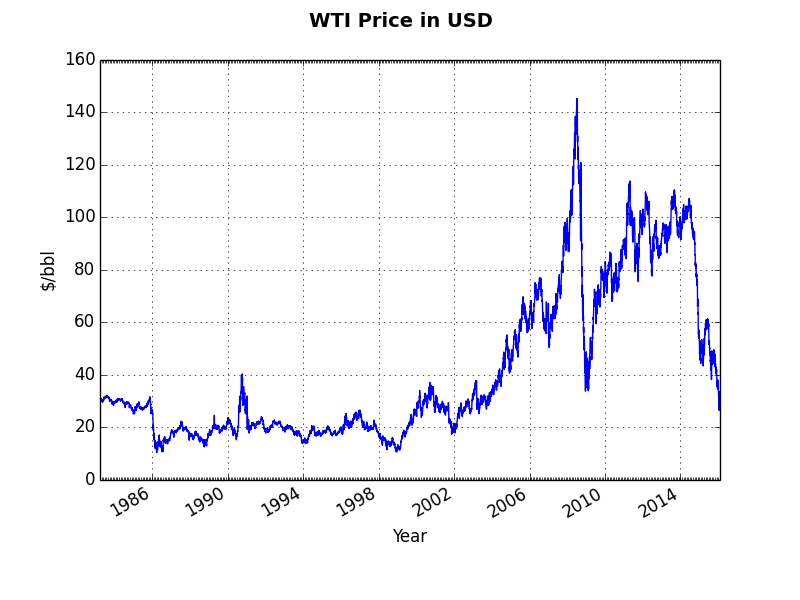
All subsequence analysis will involve slicing daily data with a linear model to find correlation coefficients with moving averages. For those needing a primer on statistics, correlation coefficient is the r in r
The first set of graphs are the correlation coefficients using a moving average with various window sizes. MA50 is a 50 day moving average. Meaning today’s MA50 would be the average of the last 50 data points including today. Shorter windows are inherently noisy but we can smoothen them out with longer windows such as the 200 day moving average.


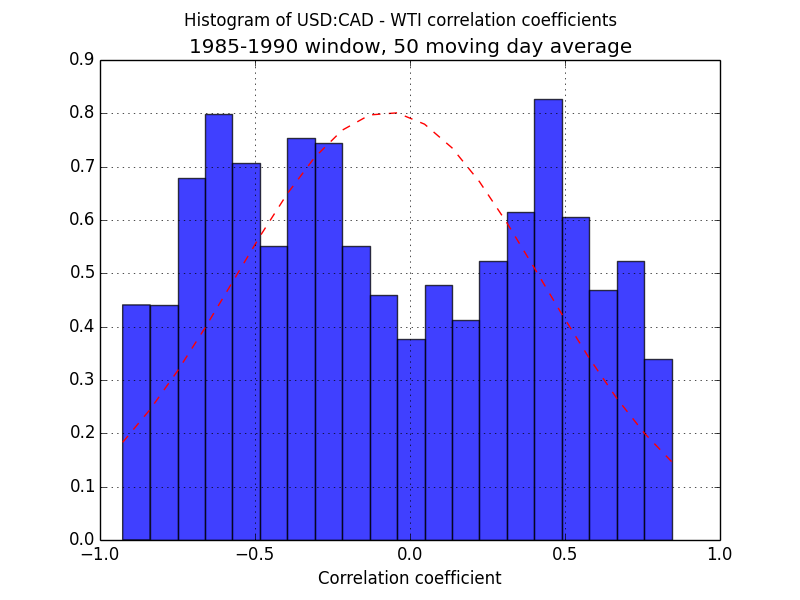
To get a more intuitive understanding of the data we can plot the correlation coefficients on a histogram during various time periods. This would help us gain insight into when the correlation developed, and determine if it is changing. The red line is a best fit of the data to a normal distribution.
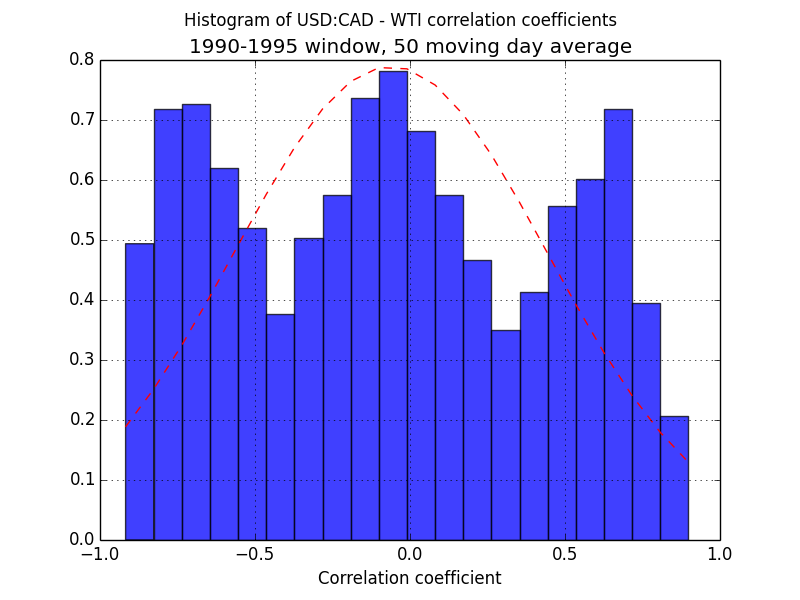
Prior to 1995 we see no significant correlation between oil and USDCAD with the MA50. There is a large spread in the r’s and the peak of the normal distribution is close to zero.
During 1995-2000 we see a negative correlation begin to develop. The peak of the normal distribution is now in negative territory and we see larger frequencies of almost perfectly negatively correlated movements between USD:CAD and WTI. This isn’t a harbinger for the commodity super cycle since the CAD declined during this period.
Between 2000-2005 we see a more 1980’s like flat distribution
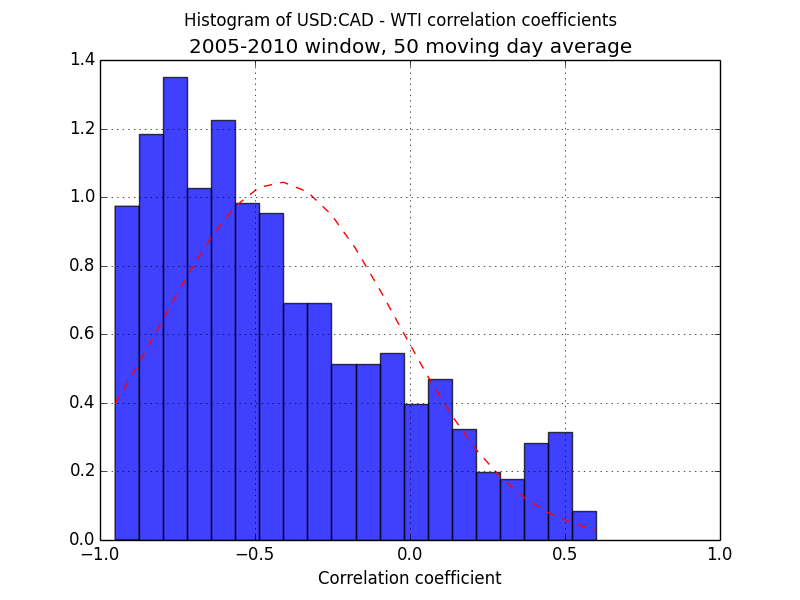
A drastic change in the distribution occurs between 2005-2010 (which happens to be when I was mostly in undergrad at Waterloo). The peak of the normal distribution is now at -0.5 – meaning 50% of the USD:CAD fluctuation can be accounted for the price of WTI.
2010-2015 looks more or less like 2005-2010 (mostly my PhD years at UofT). Although the USD:CAD looks more in-sync with WTI than the boom years.
Another correlation that I didn’t plot is that when I am in university there is a negative correlation between USD:CAD and WTI. So if I graduate in a year or two this nightmare for the CAD will end.


Leave your response!